Reports
The Report provides both numerical and graphical feedback on the usage status of all modules used throughout the application.
It is the area where the report graphic and detailed breakdown can be created according to the "Chart Type", "Measurement Type" and "View Type" determined after choosing one of the Lead, Account, Contact, Activity, Opportunity, Invoice or Goal modules.
"Dashboards" can be created to associate more than one report and graphic created. Thus, related graphics can be displayed under a category.
Adding New Report
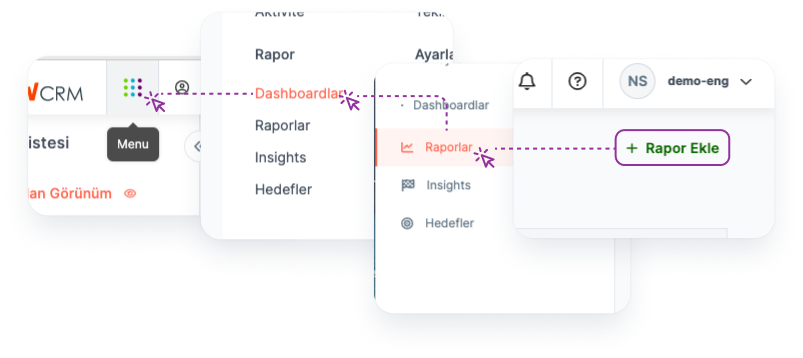
A new report can be created by clicking the "Add Report" button on the "Reports" page where the reports are listed.
Main Menu > Dashboard > Reports > Add Report
Adding New Dashboard
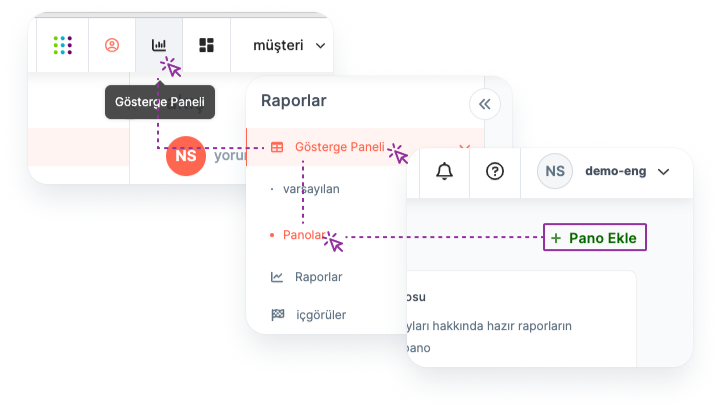
A new Dashboard can be created by going to the "Dashboards" page where the Dashboards are listed.
Main Menu > Dashboard > Dashboards > Add Dashboard
Adding Report to Dashboard
Adding a report to the Dashboard:
Main Menu > Dashboard > Default > Add Report to Dashboard
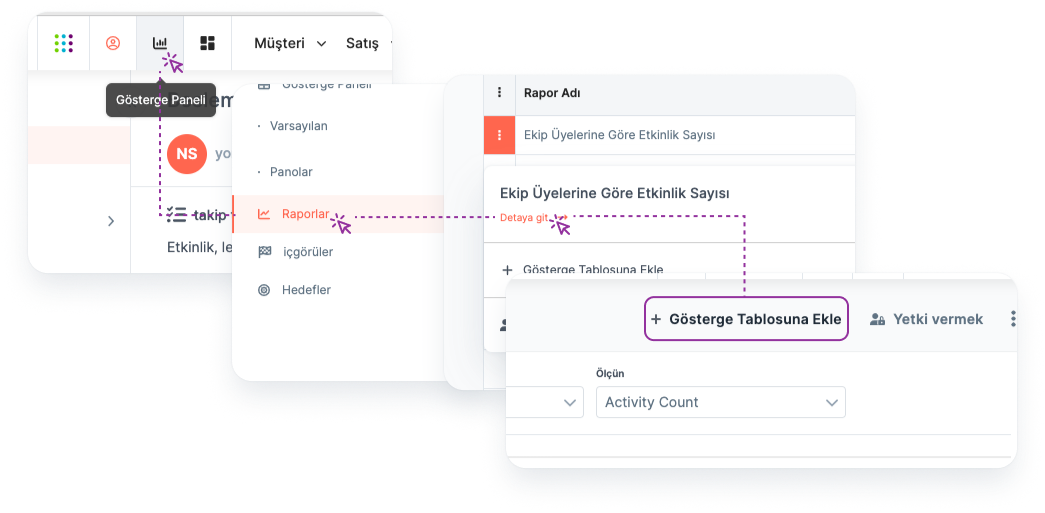
A new dashboard can be added for the relevant report by going to the report detail from the report title.
Main Menu > Dashboard > Reports > Report Title > Report Detail > Add to Dashboard
Listing Added Reports
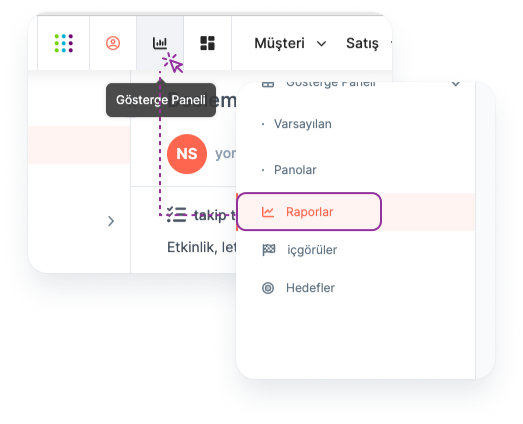
To list the Reports you have added:
Main Menu > Dashboard > Reports
Listing Added Dashboards
To list the Dashboards you've added:
Main Menu > Dashboard > Dashboards
Note: Dashboards can be listed under two headings as "Default" and "Dashboards". In the Default field, dashboards of the relevant reports can be created and displayed.
In the Dashboards area, the related graphics from the reports created on the default page can be displayed under a category.
Report Detail Page
All information related to the report is available on the Report detail page.
Accessing Report Detail
By clicking on Report Title, Report details can be accessed.
Main Menu > Dashboard > Reports > Report Title > Report Detail
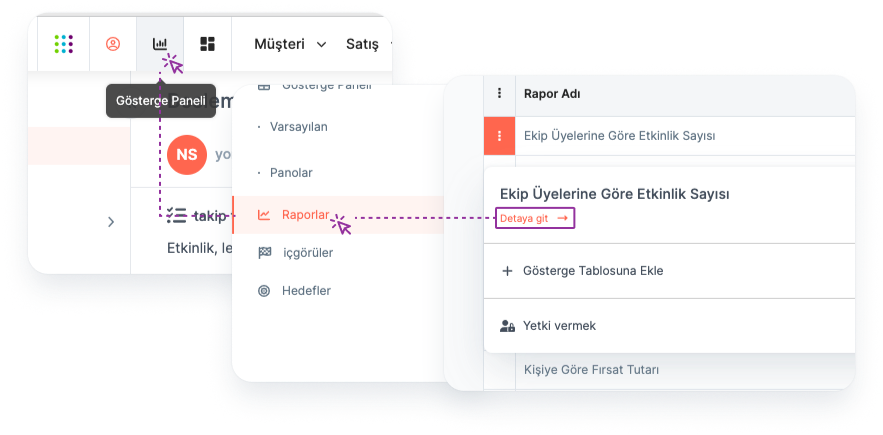
Report detail can be accessed by clicking on the three dots to the left of the relevant report title in the report list view and clicking the Go to Details button.
Main Menu > Dashboard > Reports > Three Dots > Drill Down
Fields in Report Details:
In the detail page of the relevant report, there are areas where data is visualized according to user preferences.
The list of data belonging to the module selected according to the specified criteria can also be displayed on the relevant detail page.
Chart Type: It is the field where one of the chart types "Bar", "Pie" or "Score" is selected to display the report.
Measurement Type: The measurement types that can be determined for the selected module are automatically brought by the system.
For example; In the report created for the contact module, the measurement type can be selected as the number of contact.
- View Type: It is determined on which data basis the selected module will be displayed.
Dashboard Detail Page
All information related to Dashboards is available on the Dashboard detail page.
Accessing Dashboard Detail
By clicking on Dashboard Title, Dashboard detail is accessed.
Main Menu > Dashboard > Dashboards > Dashboard Title > Dashboard Detail
Fields in Dashboard Details
Graphical versions of the reports within the specified category can be displayed in the dashboard detail.
Report Owner's Powers
The user who created the reports is called "Report Owner" and has the following privileges on the Report:
Viewing
Arrangement
Deletion
Authorization
*Note: Users in the same team can view, edit and delete Reports created by different people within the team.*
Report Editing
🔒 The user must be in the same team as Report Owner or "Report Owner" for this operation.
Editing can be done on the report detail page.
Main Menu > Dashboard > Reports > Report Title > Report Detail > Three Dots > Edit
Edit Dashboard
🔒 User must be in the same team as Dashboard Owner or "Dashboard Owner" for this operation.
Editing can be done from the Dashboard detail page.
Main Menu > Dashboard > Dashboards > Dashboard Title > Dashboard Detail > Three Dots > Edit
Deleting a Report
🔒 The user must be in the same team as Report Owner or "Report Owner" for this operation.
Deletion can be done on the report detail page.
Main Menu > Dashboard > Reports > Report Title > Report Detail > Three Dots > Delete
Deleting Dashboard
🔒 User must be in the same team as Dashboard Owner or "Dashboard Owner" for this operation.
Deletion can be done from the Dashboard detail page.
Main Menu > Dashbard > Dashboards > Dashboard Title > Dashboard Detail > Three Dots > Delete
Authorizing Users in Different Teams on the Report
🔒 The user must be Report Owner for this operation.
Authorization can be done on the Report detail page:
Main Menu > Dashboard > Reports > Report Title > Report Detail > Authorize
Authorization can be done from the Report listing page by clicking on the three dots on the left side of the relevant Report.
Main Menu > Dashboard > Reports > Report Title > Three Dots > Authorize
The Reporter can authorize users in different teams to:
Viewing
Deletion
Arrangement
Authorizing Users in Different Teams on Dashboard
🔒 User must be Dashboard Owner for this operation.
Authorization can be done on the Dashboard detail page:
Main Menu > Dashboard > Dashboards > Dashboard Title > Dashboard Detail > Authorize
The Dashboard Owner can authorize users in different teams to:
Viewing
Deletion
Arrangement
Fields in the Add Report Form
Required Fields:
The following fields are required to be filled while generating reports:
Report Name: Indicates the name to be given to the report.
Source: This is the field where the relevant module is selected for the report to be created.
Fields in Dashboard Addition Form
Required Fields:
When generating reports, the following fields are required to be filled:
- Dashboard Name: Refers to the name of the Dashboards.